
From bloated warehouse to conversational analytics: What we learned at Careem
In early 2024 we pasted a question into a large language model: for customers who placed their first food order during last month’s promotion, how many came back for a second order within fourteen days, by city? We gave the model everything we thought it needed. The full schema of the table, column descriptions, a few example queries. It came back with confident, well-formatted SQL that picked the wrong order-date column for “first order,” filtered on a status value that didn’t exist, and counted every city twice through a bad join. It would have returned a number nobody in a meeting could have caught as wrong.
The table it was looking at had more than a hundred columns and lived in a schema called now_prod_dwh, which said nothing about which business it belonged to; three other tables could have answered the question with three different numbers. The easy conclusion was that the model wasn’t good enough yet. The uncomfortable one was that we were asking it to find a needle in a warehouse we couldn’t navigate ourselves. We chose the uncomfortable one, and it set the next two and a half years.
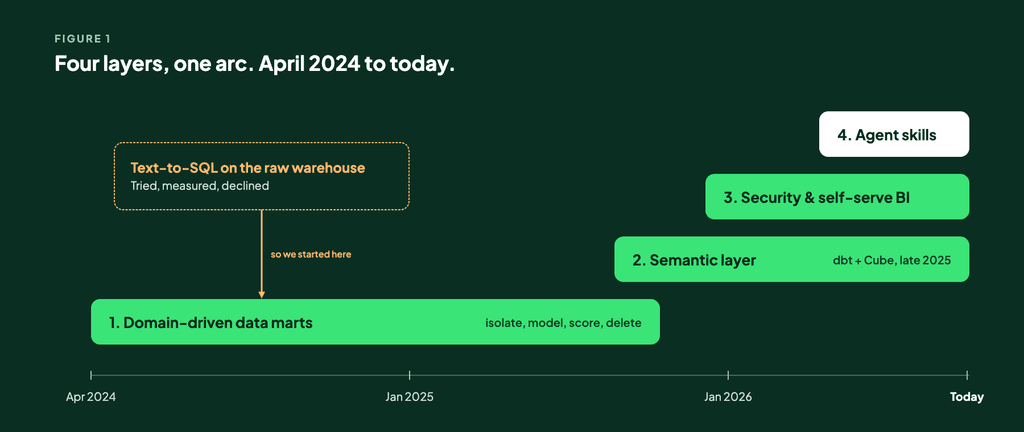
The diagnosis, and the bet
Careem is a super app: ride-hailing, food, grocery, payments, a marketplace, a subscription product, each with its own metrics, vocabulary and analysts. Our warehouse had grown the way most do, a ride-hailing core built years earlier with everything else bolted on as the company expanded. Newer businesses waited for ride-hailing pipelines to finish before theirs could start, a failure anywhere took everything down, and tables had names like quik_prod_dwh. Item_stock_updates_180d_snapshot_daily, which was misleading, out of date and too long all at once. When we put models in front of that, they did what any new analyst would: they guessed.
A bigger context window doesn’t make a hundred-column table less ambiguous. It just lets you pay more tokens to be wrong in more detail.
So in April 2024 we wrote down a different thesis. The model is not the bottleneck. The substrate is.
If we wanted machines to answer questions about our business, we first had to build a warehouse that a human could answer questions from in an afternoon.
This was not a comfortable position to hold. Every quarter the models got better, and every quarter someone reasonably asked whether the thesis was still right. We’ll come back to how that question aged.
Layer one: data marts built for the next reader, human or machine
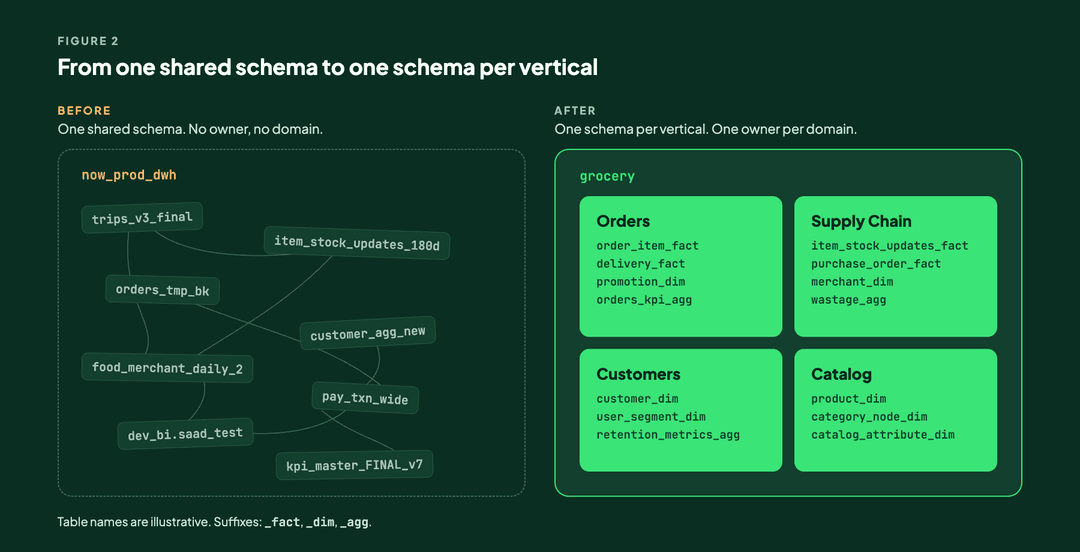
AI-first isolated data marts. Both adjectives were deliberate. Isolated: cut every business loose from the ride-hailing pipelines, with separate schemas, separate DAGs and a blast radius you could draw on a whiteboard. AI-first: test every design decision against one question. If a system that has never seen this data had to use it, would it understand?
That question produced a blueprint that became the definition of done for every vertical. Each mart is split into domains that mirror how the business talks about itself; Grocery (Quik as the business brand) became Orders, Customers, Supply Chain and Catalog. Tables follow a naming contract, {domain}.{what it contains}_{type}, so the ugly table above became grocery.quik_item_stock_updates_fact. Read the name and you know which business it belongs to, what’s in it, and whether it’s a fact, a dimension or an aggregate.
The scorecard did more work than the architecture
Early on we wrote a scorecard: ten dimensions, weighted, applied identically to every vertical, with a named owner per column. It became the most important management artefact of the programme because it answered the two questions that consume a data leader’s week: what does “done” mean here, and where, honestly, are we?
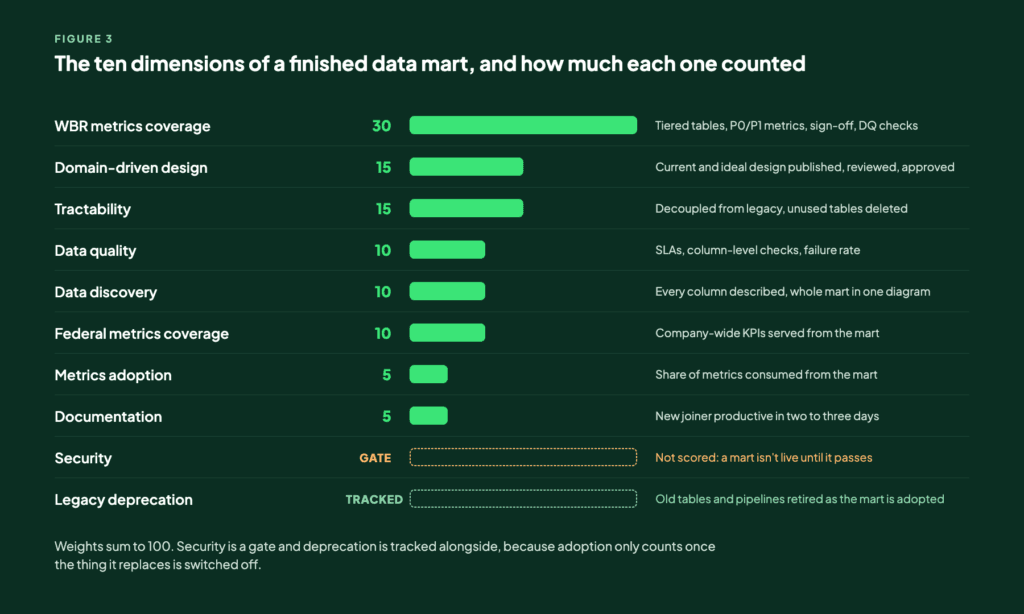
First, the rows inside each dimension are a sequence, not a checklist: publish the tiered table list, agree P0 and P1 metrics with stakeholders, get the custodian’s sign-off, then put data quality on tier 0, then tier 1. Teams that skipped ahead ended up testing the wrong things.
Second, tractability got its own weight: deleting tables counted as much as modelling them. Finance went from roughly 2,700 legacy tables to under 800, a cut of about 70%. Grocery retired all 400 of its legacy tables and rebuilt the domain as about 50, each with a name you could read, nearly 90% fewer. If you don’t score the deletion, nobody does it, and the new mart sits next to the old mess forever.
We hadn’t done any AI yet. That was the point.
The problem the marts created
Once the marts were trusted, everyone wanted their metric in one. But only data engineers could change a mart, and we had made that bar deliberately high. Analysts who needed a new cohort definition or a slight variation of GMV for a partner review could wait in the data engineering queue or build it themselves somewhere ungoverned. They chose the second, as any sensible person would, and the count of personal dev_bi tables, which the programme had driven down, started climbing again as the businesses continued to evolve.
Despite aligning on the metrics definition in the concept of Federal Metrics (if a metric is reused in more than one business, it’s a federal metric with a governance on what it means), however the metric definitions implementations still lived in the SQL of individual dashboards, so two people could query the same mart and walk into a meeting with two different numbers. The marts themselves were fine; what was missing was an abstraction layer on top of them.
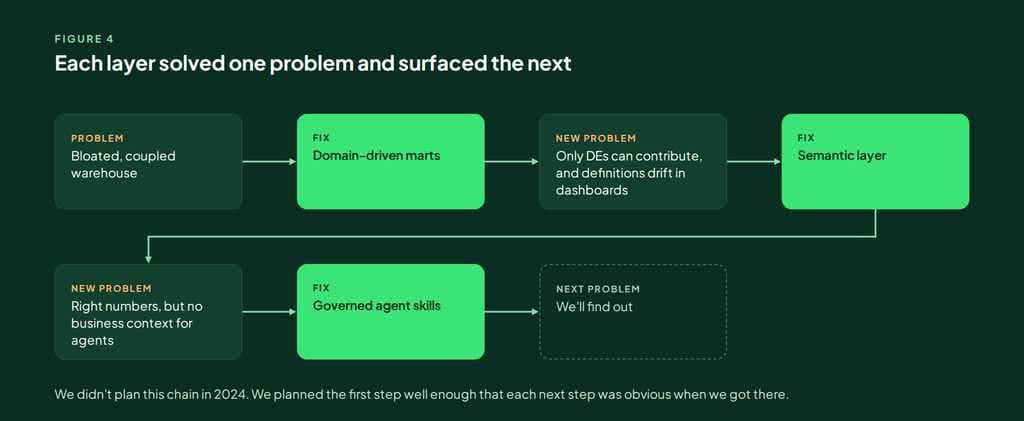
For most of 2024 we shipped nothing a business leader could see: we were deleting tables and arguing about whether a column belonged in Orders or Customers while the teams around us demoed chatbots, and the scorecard was what turned “trust us” into “here is the number, here is last month’s number.” The semantic layer was harder to defend, because the BI tool was already paid for, and it took a leadership team willing to fund a bet whose payoff was “we’ll be able to switch assistants in 2026 and derisk vendor lock-in.” Skills meant admitting to the same stakeholders that the previous layer wasn’t enough. It’s easier to hold a bet than to extend one.
In the data realm, progress is defined by stable architecture. True value is realized when the fifth quarter arrives and the foundation built in the first remains steadfast.
If you’re starting in 2026
- Sequence beats tooling. Domain modeling, then marts & definitions, then serving, then expertise; every team we’ve seen skip a step builds the next layer on sand and spends the following year back-filling.
- Invest in an open semantic layer, outside your BI tool, and invest heavily. The BI tool will change and the assistant will change twice; the definition of GMV has to live somewhere neither of them owns, and that is also where consistency and security get enforced once. Open source is not free, though. We ran a war room for weeks, sent several pull requests upstream to open source Cube, fixed integration issues on the BI side ourselves, and worked through more teething problems than we would like to admit. It was worth every hour, and we shared what we learned at DBT Summit 2026.
- Govern prompts the way you govern tables. A prompt that depends on a metric is a downstream asset of that metric: give it an owner, a declared dependency, a test and a place in your lineage graph.
- Build the scorecard before the thing it scores. Weights are strategy, and deciding that deletion counts and that security is a gate rather than a score is the clearest statement of priorities a leader can make.
Two and a half years ago we asked a model a question and got a confident wrong answer. Today anyone at Careem can ask a harder one and get the number the business runs on, with the caveats an expert would add, from an assistant we could replace tomorrow without losing a single definition. Very little of that came from the model getting better. Most of it came from deciding, early, that it wasn’t the model’s job to be right about data we hadn’t made legible.
That’s the bet. It’s still paying.


